My Grade 10 Academic class wrote a unit test this week assessing student's knowledge of quadratic relations when the equation is given either in vertex form 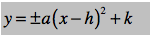 or factored form
  .
.
They were expected to
- graph the parabola given the equation in either form,
- determine the equation, in either form, given details about the parabola
Here is an email exchange I had with a student while they were studying:
Student Question:

My Response:
2.
3.
4.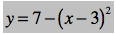
We have seen questions like this. Rewrite it as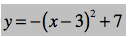 . This is
a parabola that opens down and has a vertex at (3, 7).
. This is
a parabola that opens down and has a vertex at (3, 7).
5. We have seen questions like this. This is the equation in vertex form however the vertex has fraction values
  .
.
Student Reply:
 or factored form
  .
. They were expected to
- graph the parabola given the equation in either form,
- determine the equation, in either form, given details about the parabola
Here is an email exchange I had with a student while they were studying:
Student Question:
I
was looking through the review that you handed out to us, and as I was
going through it, I had never seen over half of the questions on it.
Some of the questions that I was completely confused on were:

Please
let me know if questions like these will be on the test, as I have
never seen any questions like these in the work that we have done
leading up to the test so far.
My Response:
1. 

We have seen questions like this. Rewrite it as  . This is a parabola that opens down and has a vertex at (0, 9).
 . This is a parabola that opens down and has a vertex at (0, 9).
2.

Not a focus on this test. We will see these in Unit 4.
3.

Not a focus on this test. We will see these in Unit 4.
4.

We have seen questions like this. Rewrite it as
 . This is
a parabola that opens down and has a vertex at (3, 7).
. This is
a parabola that opens down and has a vertex at (3, 7).5.

 .
. Student Reply:
I did not know that we were able to re-write equations, as well as I did not know that x and y values could be fractions that large.
Thank you very much Ms. Gravel!
The reply took me by surprise. Because none of the examples I used in the unit had the vertical shift come first, the student had memorized the "formula" for the equation and not understood the separate parts of the equation. (Disclaimer: Most of my lessons did involve investigations however all the written examples had the equation in the same order).
I shared this exchange with a colleague and they recalled a similar experience with one of their students a few years back. My colleague was teaching the Pythagorean Theorem and a student stated that his example

was not a right triangle.
After many minutes going back and forth, the student finally exclaimed that it wasn't a right triangle because it wasn't in this orientation.

It was then, like for me in this situation, that my colleague realized that he needed examples of right triangles in all orientations to emphasize understanding and not memorization.
Food for thought for the next unit...


